Someone needs to calculate the power of the engine unit in order to calculate the car tax. For some, it is important to independently calculate the power of the compressor engine. For some, it is important to know exactly the power of the machine in order to compare it with the one that was declared. In general, power calculation and engine selection are two inseparable processes.
These are not the only reasons why car enthusiasts try to independently calculate the engine power of their cars. This is quite difficult to do without the necessary formulas for calculation. They will be presented in this article so that every motorist can calculate for himself how much the real engine power of his car is.
You might be interested in: Expanding your vocabulary: a guest is...
Introduction
There are at least four common ways to calculate the power of an internal combustion engine. These methods use the following parameters of the propulsion unit:
- Revolutions.
- Volume.
- Torque.
- Effective pressure inside the combustion chamber.
- quality of the fuel mixture;
- combustion completeness;
- fuel losses.
For calculations, you need to know the weight of the car, as well as the acceleration time to 100 km/h.
Each of the following formulas for calculating engine power has some error and cannot give a 100% accurate result. This should always be taken into account when analyzing the data obtained.
If you calculate the power using all the formulas that will be described in the article, you can find out the average value of the actual engine power, and the discrepancy with the actual result will be no more than 10%.
You might be interested in: How to find the product of matrices. Matrix multiplication. Dot product of matrices. Product of three matrices
If we do not take into account various scientific subtleties associated with the definition of technical concepts, we can say that power is the energy generated by the motor unit and converted into torque on the shaft. In this case, power is not a constant quantity, and its maximum value is achieved at a certain shaft rotation speed (indicated in the passport data).
In modern internal combustion engines, maximum power is achieved at 5.5-6.6 thousand revolutions per minute. It is observed at the highest average effective pressure in the cylinders. The magnitude of this pressure depends on the following parameters:
Power, as a physical quantity, is measured in Watts, and in the automotive industry it is measured in horsepower. The calculations described in the methods below will give results in kilowatts, then they will need to be converted to horsepower using a special converter calculator.
Calculation of engine power: methods and necessary formulas
Engine power is the energy that is generated inside the internal combustion engine during its operation. This indicator is key for any car, and many motorists rely on it when choosing a car. It can be defined in various ways. Let's list the main methods:
- Through revolutions and torque.
- By volume of internal combustion engine.
- By air flow.
- In terms of weight and acceleration time to 100 kilometers per hour.
- According to the performance of injection nozzles.
The main unit of measurement for power is watts, but it is sometimes expressed in terms of horsepower. There is a simple relationship between these units of measurement, so if necessary, horsepower can be easily converted to watts (and vice versa).
In our article, we will look at the basic formulas for determining power, and also learn how to convert horsepower to watts.
Power via torque
You might be interested in: What does it mean to be stupefied? Definition and synonyms
One way to calculate power is to determine the dependence of motor torque on the number of revolutions.
Any moment in physics is the product of a force and the shoulder of its application. Torque is the product of the force that the engine can develop to overcome the resistance of the load and the shoulder of its application. It is this parameter that determines how quickly the motor reaches its maximum power.
Torque can be defined as the ratio of the product of the working volume and the average effective pressure in the combustion chamber to 0.12566 (constant):
- M = (Vworking * Peffective)/0.12566, where Vworking is the working volume of the engine [l], Peffective is the effective pressure in the combustion chamber [bar].
Engine speed characterizes the speed of rotation of the crankshaft.
Using the values of torque and engine speed, you can use the following formula to calculate engine power:
- P = (M * n)/9549, where M – torque [Nm], n – shaft rotation speed [rpm], 9549 – proportionality coefficient.
The calculated power is measured in kilowatts. To convert the calculated value into horsepower, you need to multiply the result by a proportionality coefficient of 1.36.
This method of calculation consists of using only two elementary formulas, therefore it is considered one of the simplest. True, you can do it even simpler and use an online calculator, into which you need to enter certain data about the car and its engine unit.
It is worth noting that this formula for calculating engine power allows you to calculate only the power that is obtained at the output of the engine, and not that which actually reaches the wheels of the car. What is the difference? While the power (if you imagine it as a flow) reaches the wheels, it experiences losses in the transfer case, for example. Secondary consumers such as an air conditioner or generator also play a significant role. It is impossible not to mention the losses due to overcoming resistance to lifting, rolling, and aerodynamic resistance.
This disadvantage is partially compensated by the use of other calculation formulas.
Horsepower calculation
If you know the amount of horsepower of your engine, then you can easily find out and calculate the engine power. A simple formula is used to calculate:
M = M(LS) x 0.735
It deciphers like this:
- M(LS) - power of an internal combustion engine, expressed in horsepower.
- 0.735 is a correction factor by which you need to multiply the number of your “horses”.
Power via engine displacement
It is not always possible to determine the engine torque. Sometimes car owners do not even know the meaning of this parameter. In this case, the power of the engine unit can be determined using the engine volume.
To do this, you will need to multiply the volume of the unit by the crankshaft speed, as well as by the average effective pressure. The resulting value must be divided by 120:
- P = (V * n * Peffective)/120 where V – engine volume [cm3], n – crankshaft rotation speed [rpm], Peffective – average effective pressure [MPA], 120 – constant, proportionality coefficient.
This is how the power of a car engine is calculated using the volume of the unit.
Most often, the Peffective value in standard gasoline engines varies from 0.82 MPa to 0.85 MPa, in forced engines - 0.9 MPa, and in diesel units the pressure value ranges from 0.9 MPa to 2.5 MPa.
You will be interested: “Unexpected” - what is it? Meaning of the word
When using this formula to calculate the actual power of the motor, to convert kW to hp. s., it is necessary to divide the resulting value by a coefficient equal to 0.735.
This calculation method is also far from the most complicated and takes a minimum of time and effort.
Using this method, you can calculate the power of the pump motor.
CHAPTER 3. ACTUAL CYCLES, POWER, EFFICIENCY OF INTERNAL COMBUSTION ENGINES
Home / Publications / Literature / Bookshelf / A. Agatov. Outboard motorsFour-stroke engine.
We constructed theoretical indicator diagrams without taking into account the losses that always occur during engine operation. So, for example, during suction, the carburetor, suction valve and suction pipe exert hydraulic resistance to the movement of gases, and the greater the gas speed in the suction system, the greater the resistance. For this reason, the actual suction pressure is always lower than atmospheric pressure and depends on the length and flow area of the pipe, the smoothness of the transitions, the precision of the manufacture of valves and valve seats, the resistance in the carburetor and the streamlined shape of the parts encountered along the flow path. This is taken into account by the dotted curve a1;b1;
in the diagram fig. 11, i.e. the charge enters the cylinder of reduced density. The heating of the mixture from hot parts also contributes to a decrease in its density.
Thus, the weight amount of charge in the cylinder is reduced, which is taken into account by the filling factor
ηv. The filling factor shows how much, by weight, of fresh charge filled the cylinder compared to what could have been contained if the temperature and pressure of the charge had been equal to atmospheric conditions.
For modern high-speed light engines, the filling coefficient at full throttle opening is in the range of 0.8-0.9, i.e. the engine cylinder is filled only to 80-90% of its full volume under normal conditions (1).
ηv is affected to a certain extent by excess fuel, which lowers the suction temperature and. combustion, and with them the temperature of the cylinder, piston and head.
A mixture containing more fuel than required for a normal mixture is called rich. However, working with a rich mixture is uneconomical, since part of the fuel does not burn completely due to lack of air and goes out with exhaust gases in the form of soot, and partly carbon monoxide CO.
The type of fuel also affects. Each type of fuel has its own latent heat of vaporization, which determines the temperature and amount of the mixture sucked in. For example, the use of alcohol as fuel increases ηv by 5-10% compared to gasoline.
Since the amount of released thermal energy, and therefore the engine power, is directly dependent on the weight charge of the cylinder, the driver’s task is to use all factors that contribute to an increase in ηv.
Let's consider the influence of valve timing on cylinder filling.
In high-speed engines, when the cycles follow each other very quickly, the intake mixture moves through the pipeline at a speed of approximately 100 m/sec. With the closing of the intake valve, due to the inertia of the moving gases, by the beginning of the intake of the next cycle, a certain pressure (compression) of the mixture is formed in front of the valve, exceeding atmospheric pressure. At this moment, the intake valve begins to open again and the pressurized mixture rushes into the cylinder with force; This way you can get better filling of the cylinder. Therefore, most often, depending on the speed of the engine, the intake start is advanced from 8 to 40°, and in racing cars it is brought up to 75° and higher. This intake advance is usually established experimentally. The intake valve is also closed not at BDC, as in the theoretical cycle, but later, at approximately 45-70°, giving more time to fill the cylinder. In this way, the filling period is extended from 220 to 290° along the crankshaft rotation instead of 180° of the theoretical cycle, which increases the filling coefficient ηv.
The next factor influencing the filling of the cylinder is the residual gases from the previous cycle. In four-stroke engines, burnt gases are partially retained in the so-called harmful space, i.e. in the compression chamber Vc.
Since the compression stroke follows directly after the suction stroke, the compression of the mixture actually begins not at BDC, but with a delay equal to the end of the exhaust, which results in some loss of part of the stroke. In addition, during the compression stroke we have additional heat loss both for heating the cylinder wall and head, and the piston bottom, which is reflected by a decrease in compression pressure (dashed curve ac1; in the diagram in Fig. 11).
Compressing the mixture is necessary in order to speed up the process of its combustion and obtain greater pressure on the piston both during the flash and during the working stroke. Increasing operating pressure increases engine power. The higher the compression ratio in the engine, the greater its power, the lower the specific fuel consumption, i.e. consumption per 1 liter. With. h., the higher the thermal efficiency of the engine. However, increasing the compression ratio is only possible up to a certain limit, depending mainly on the auto-ignition temperature of the working mixture and on the occurrence of detonation (2) in the engine. Both self-ignition and detonation are undesirable: they disrupt the normal operation of the engine. In modern high-speed engines, the compression ratio usually reaches 5-8, and the compression end pressure is about 7.5-11 kg/cm². In this case, the temperature reaches 270-350°.
The combustion of the mixture does not actually occur instantly, but requires from 1/300 to 1/600 of a second, so the mixture is ignited with some advance c1.
During expansion, due to the large temperature difference between the wall and the gases, some of the heat is lost into the walls and the pressure decreases. All pressure transitions from the compression stroke to the expansion stroke occur smoothly, without sharp peaks and depend entirely on the amount of ignition timing (Fig. 11, dotted curve c1c2z1e1).
The amount of pressure reduction during the expansion stroke depends on the intensity of cooling of the cylinder walls, its diameter and the number of revolutions; The higher the speed and the larger the cylinder diameter, the higher the expansion pressure line on the indicator diagram. Not reaching approximately 50-70° to BDC during expansion, in order to better clean the cylinder, the exhaust is advanced: the exhaust valve opens, exhaust gases flow out of the cylinder at a critical speed (the speed of sound) and the pressure drops sharply, which is shown in the diagram by line e1a1.
The release of exhaust gases always occurs at an increased pressure of the order of 1.1-1.2 cm², and the temperature of the gases at the end of the release reaches approximately 500-600°. Closing the exhaust valve to better clean the cylinder from burnt gases is also done not at TDC, as in the theoretical cycle, but much later. For high-speed engines, the release delay is increased to 30-40°, and for racing engines to 55° and higher. It is useful to note here that near TDC, the intake valve and exhaust valve are open for some time at the same time, since the intake valve opens before TDC, and the exhaust valve closes after TDC. This overlap often reaches 60° in engines, reaching 100-120° in racing engines.
Similar diagrams can be obtained directly from a running engine using a device called an indicator.
This is where these charts got their name
indicator
.
Indicator diagrams characterize the operation of the piston during one engine cycle, where the ordinate axis shows the pressure in the cylinder in kilograms per square centimeter, and the abscissa axis shows the volumes in cubic centimeters on a certain scale. By measuring the area of the diagram using some method and multiplying it by the scale taken to depict it, we obtain the engine operation in one cycle.
Most often, the area of the diagram is reduced to an equal-sized rectangle, the base of which is equal to the stroke of the piston on the scale we choose, and the height is equal to the average pressure during the stroke of the piston (line cl). This pressure is called the average indicator pressure
and is of great importance when calculating the indicated engine power and when comparing different engines with each other.
Two-stroke engine. The actual indicator diagram of a two-stroke engine, like the indicator diagram of a four-stroke engine, also differs greatly from the theoretical one due to the advance of ignition of the mixture in the cylinder, hydraulic losses in windows and pipelines, heat leakage into the cylinder walls and purge losses during expansion and compression (see Fig. 15).
At the end of the compression stroke, to obtain the working stroke of the piston, as already mentioned, it is necessary to ignite the mixture. Fuel combustion does not occur instantly, but requires, albeit a very short (about 1/zoo fraction of a second), time, during which the piston will have time to advance approximately 8-9% of its working stroke. This leads to a strong decrease in both the maximum and average pressure along the piston, i.e., to a loss of engine power and incomplete combustion of the mixture.
In order to better use the heat contained in the fuel, it is necessary to give more time for its combustion, and for this the mixture is ignited much earlier than the piston reaches TDC, or, as they say, with some advance, the greater the faster the engine (line c2c3).
It is also undesirable to do very early ignition, as the engine becomes rough (hard running). Shocks appear, the torque on the shaft becomes uneven, and sometimes this even causes the crankshaft to turn back and stop the engine.
Ignition is carried out in such a way as to obtain maximum pressure 10-20° after TDC. To achieve this, ignition timing in high-speed engines is usually set within 30-45° before TDC. The operating diagram is more advanced and the power is greater than when the mixture is ignited at TDC.
In practice, ignition advance is carried out either by hand, by turning a special lever, or using an automatic regulator installed on the magneto and increasing! ignition advance with increasing engine speed. Such regulators are installed on our latest domestic designs of outboard motors LMM-6 and LMR-6.
One of the significant losses that distorts the theoretical diagram is the loss on the stroke of the piston due to the presence of purge and exhaust ports.
Since in two-stroke engines the cleaning of the cylinders from burnt gases and filling them with a fresh mixture occurs through the corresponding windows, then from the beginning of the opening of the latter until the moment of closing, the pressure in the cylinder is established close to atmospheric and the compression process does not begin immediately after BDC, but only from the moment the windows are closed ; the same thing and the working stroke ends not at BDC, as we considered in the ideal cycle, but earlier, from the moment they begin to open. Thus, over the height of the windows, there is a loss of working stroke. The height of these windows takes about 10-15% of the piston stroke.
The duration of opening of each row of windows is obviously determined by its height: the higher the window, the longer the path traversed by the piston along the window, and therefore the longer the period of time the window remains open. The time, or period, of a particular process, expressed in degrees of rotation of the crankshaft, is called the process phase
, or
valve timing
. Valve timing is usually represented by pie charts. This kind of diagram for the LMR-6 motor is shown in Fig. 16.
From Fig. 16a it can be seen that when the piston moves upward, the purge windows close first, while the exhaust windows are still open and the release of gases continues, as a result of which part of the sucked mixture flies out. This reduces the filling factor ?v and reduces engine power. The increase in engine filling is greatly influenced by the suction process. A significantly better filling of the crankcase with the mixture is obtained with spool distribution, when suction can begin immediately after closing the purge windows, and the mixture is pressurized immediately after the piston passes TDC, as shown in the diagram (Fig. 16.6), and occurs throughout the rest of the piston stroke, until new opening of purge windows.
In Fig. 17 shows a number of designs for spool valve intake control. The disc spool is a disc with a through window for air intake. With its polished side, it is constantly pressed by means of a weak spring against the end of one of the side walls of the crankcase, on which the suction window is cut. When the spool rotates, its window runs into the crankcase window, periodically communicating the latter with the atmosphere.
Rice. 16. Circular diagrams of gas distribution with piston and spool inlet of the mixture: a - piston distribution; b - spool distribution
Sometimes spools are made in the form of a hollow drum with a window on a cylindrical surface. Cylindrical spools for free rotation are made with some clearance. During compression, the mixture will partially flow through the gap into the crankcase; cylindrical spools are used only on high-speed engines, where the influence of the clearance is negligible.
Hydraulic losses and pressure drop throughout the power stroke remain approximately the same as for a four-stroke engine.
The sum of all the listed losses in the indicator diagram of a two-stroke engine is approximately 8-10% of the theoretical cycle diagram, and therefore, to determine the operation of the cycle, you can use the latter, reducing it by the specified percentage.
You can determine the area of the diagram either using a special device (planimeter), or by drawing it on graph paper and counting the number of millimeters contained inside the diagram. The area is multiplied by the scale of the diagram to obtain the actual work done by the cylinder in one cycle.
The duration of individual phases according to the angle of rotation of the crankshaft in modern two-stroke outboard engines varies within the following range: for suction ports 100–115°, for vent ports 86–115°, for exhaust ports 110–135°.
Making a summary of all the phenomena in the cylinder of a two-stroke engine for a full cycle, we get the following picture: 1st stroke - piston stroke to TDC:
above the piston compression of the mixture / below the piston suction of the mixture.
Rice. 17. Designs of spools for inlet of the working mixture into the crankcase: a - disk spool; b - cylindrical spool of a two-cylinder engine; c - cylindrical spool driven from a gear connected to the crankshaft; g - cylindrical spool of a four-cylinder engine
2nd stroke - piston stroke to BDC:
above the piston combustion and expansion / below the piston compression of the mixture
The cleanliness of the charge in two-stroke engines depends on the quality of the purge. The amount of exhaust gases after purging varies within very wide limits: from 3% for two-stroke engines with direct-flow purging in the presence of excess air or mixture during purging and reaches 40-50% with chamber purging.
Engine power and efficiency. From mechanics it is known that power is work done per unit of time. Work for one full cycle is expressed by the product of the average indicator pressure pi and the working volume of the cylinder.
Knowing the engine speed per minute and the average indicator pressure, it is easy to calculate its power using the formulas:
The resulting power is called
engine indicated power
. It gives an idea of the gas work transferred to the piston.
From the above formulas it is clear that the indicator power increases:
1) with increasing engine displacement Vs;
2) with increasing engine crankshaft speed n;
3) with an increase in the average indicator pressure pi;
4) with increasing number of cylinders i.
The indicator power cannot be fully used for useful work due to existing losses in the engine itself, or the so-called “mechanical losses”, which are taken into account by the mechanical efficiency factor. The power we can actually have on the crankshaft is called "effective power".
Thus, the mechanical efficiency is understood as the ratio of the effective engine power, i.e., the power actually received on the engine shaft Ne to the indicator power, i.e., the power transmitted by the gases to the engine piston Ni:
Since at different speeds ηm is not the same, it is customary to attribute to the engine only ηm obtained at the maximum achievable power Nemaks
Mechanical losses in the engine can be divided into three main types:
1. For friction losses of all moving parts of the engine: piston, piston rings, bearings. The magnitude of this type of loss is the largest and mainly depends on: a) the condition of the surfaces of the rubbing parts, b) the pressure between them and c) the nature and quality of the lubricant and is equal to approximately 55-65% of the total amount of mechanical losses.
2. Losses when actuating auxiliary mechanisms (magneto, pumps) usually fall from 6 to 18% of the total losses.
3. Losses when filling the cylinder with fresh mixture and cleaning it from exhaust gases, the so-called “hydraulic” or “pumping losses”, account for everything else. The latter losses are made up of resistance in the suction pipe, in the carburetor and in the intake windows. This includes the friction of gases on the rough surface of the channels.
Typically, mechanical losses, based on practical data, are taken equal to 10-25% of the indicated power, i.e., only 90-75% of the power transmitted by the gases to the engine pistons can be supplied to the propeller.
Effective power, like indicator power, can be expressed by the corresponding formulas:
the Pef value included in the effective power formula is called
the average effective pressure
(by analogy with the average indicator pressure). It actually cannot be measured on the engine and is conditional. It is obtained by calculating from the power formula if the engine displacement, speed and power developed by the engine on the propeller shaft are known. When the engine is built, the effective power, and therefore the average effective pressure, is determined by testing the motor or its engine on a brake machine, where the torque developed by the engine is usually measured, and the effective power is determined from the torque using the formula where Mk is expressed in kgm, and the effective the pressure is already obtained from the previously given power formulas in kilograms per square centimeter. Mean effective pressure is an important quantity and is often used when comparing different engines with each other.
For two-stroke engines of conventional outboard motors, the average effective pressure at maximum power ranges from 4 to 6 kg/cm² and for sports and racing engines - from 7 to 12 kg/cm².
As the speed increases, mechanical losses increase greatly, requiring the expenditure of useful energy, and the charge of the cylinder decreases. Losses do not increase in direct proportion to the engine speed, but with some excess and, finally, reach the value of the increase in power; this corresponds to maximum power, after which, with a further increase in the speed, the engine power begins to decrease.
Rice. 18. Typical graph of the external characteristics of the engine: Ni and Ne - power; Mk - torque; Ce - specific fuel consumption per 1 liter. With. h.; ηm - mechanical efficiency of the engine
Diagrams showing the change in effective power depending on the number of revolutions at full throttle are called
engine characteristics .
Often the same graph shows fuel consumption curves, changes in pt versus speed, changes in torque Mk, mechanical efficiency ηm, specific fuel consumption Ce and other data characterizing the engine. Such a diagram is shown in Fig. 18.
If the effective engine power is divided by the total engine displacement, expressed in liters, then we get the so-called liter power, i.e. power per liter of engine displacement.
Liter power characterizes the complete use of the volume of all engine cylinders.
For racing engines currently, liter power reaches 60-70 hp. s, and in some cases it can be much more.
Two-stroke engines, being inferior in efficiency to four-stroke engines, have, in turn, such advantages as the absence of valves and a distribution mechanism, increased liter power, ease of design and maintenance, lower specific weight and low cost of the engine to manufacture. The simpler the engine, the fewer reasons for its malfunction, the more reliable it is. Here it is necessary to note another important advantage of two-stroke engines: greater uniformity of torque, since in four-stroke engines, due to the inertia of the flywheel, three strokes are carried out, and in a two-stroke engine only one. Therefore, to establish torque uniformity, significantly lighter flywheels are required, which further reduces the overall weight of the two-stroke engine by about 10-20% or even more.
(1) Normal atmospheric conditions are defined as an atmospheric pressure of 1 kg/cm² and a temperature of +15°.
(2) For detonation, see Chapter 6.
Forward Contents Back
Power via air flow
The power of the unit can also be determined by air flow. True, this calculation method is available only to those car owners who have an on-board computer installed, which allows them to record air consumption at 5.5 thousand revolutions in third gear.
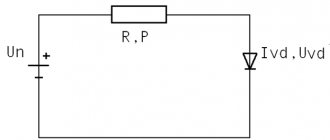
To obtain the approximate engine power, it is necessary to divide the flow rate obtained under the conditions described above by three. The formula looks like this:
- P = G/3, where G is air flow.
This calculation characterizes engine operation under ideal conditions, that is, without taking into account losses on the transmission, third-party consumers and aerodynamic resistance. The actual power is 10 or even 20% lower than calculated.
Accordingly, the amount of air flow is determined in laboratory conditions on a special stand on which the car is installed.
The readings of on-board sensors are highly dependent on their contamination and calibration.
Therefore, calculating engine power based on air flow data is far from the most accurate and efficient, but it is quite suitable for obtaining approximate data.
Counting the “horses”: folk cars on the power stand
June 25
How different are the official specifications from the real ones? We have already tested cars from the border tax-favorable category of up to 250 hp for guile. The results turned out to be different: some honestly delivered the declared power, while others fell somewhat short. But it’s one thing to have fairly powerful cars, which in any case do not suffer from a lack of traction, and quite another to be popular cars.
So we checked simpler cars. Since they have less strength, the loss of each “horse” becomes very noticeable. The same goes for torque.
So, here is our test five. In the budget segment are the Lada XRAY Cross and its competitor relative, the Renault Logan Stepway. In the golf class - the third generation Kia Ceed, which is gaining momentum. One of the leaders in the crossover camp, the updated Nissan X‑Trail, also caught our attention.
The Chinese crossover Haval H6 is not the most popular on the Russian market among its classmates, but it is quite fresh. The real power of the “Chinese”, especially with turbocharging, is gossiped about in every garage. Let's check it out!
The scattered herd
We carry out measurements together with our good friends from the AGP Motorsport workshop - on a modern Dynomax 5000 AWD dynamometer with running drums, which is designed for any type of drive. Before driving the cars onto the drums, a few words about the test methodology.
Now all manufacturers measure power at the engine flywheel with all auxiliary equipment. Naturally, we cannot remove the engine from every car. It is clear that the bench power “from the wheels” when accelerating in direct gear from 1500–2000 rpm to maximum speed will be significantly less than the net power at the flywheel. Because transmission losses are inevitable. That is why any modern stand can recalculate the results taking into account all losses.
Another coefficient automatically applied by the stand concerns test conditions. According to UNECE rules No. 85 and ISO 1585, the ambient temperature should be +25 °C, atmospheric pressure - 99 kPa.
Power through the mass of the car and acceleration time to “hundreds”
Calculation using the weight of the car and its acceleration speed to 100 km/h is one of the simplest methods for calculating the real engine power, because the weight of the car and the stated acceleration time to “hundreds” are the vehicle’s passport parameters.
This method is relevant for engines running on any type of fuel - gasoline, diesel fuel, gas - because it only takes into account the dynamics of acceleration.
When calculating, it is worth taking into account the weight of the vehicle along with the driver. Also, in order to bring the calculation result as close as possible to the actual one, it is worth taking into account the losses spent on braking, slipping, as well as the reaction speed of the gearbox. The type of drive also plays a role. For example, front-wheel drive cars lose about 0.5 seconds at the start, rear-wheel drive cars lose from 0.3 to 0.4 seconds.
All that remains is to find a calculator on the Internet to calculate the power of a car through acceleration speed, enter the necessary data and get an answer. There is no point in presenting the mathematical calculations that the calculator makes because of their complexity.
The result of the calculations will be one of the most accurate, close to the real one.
This method of calculating the real power of a car is considered by many to be the most convenient, because car owners will have to make a minimum of effort - to measure the acceleration speed of up to 100 km/h for the purity of the experiment and enter additional data into an automatic calculator.
Calculation of internal combustion engine power based on injector performance
An equally effective indicator of the power of a car engine is the performance of the injectors. Previously, we looked at its calculation and relationship, therefore, it will not be difficult to calculate the amount of horsepower using the formula. The estimated power is calculated according to the following scheme:
Where, the load factor is no more than 75-80% (0.75...0.8), the mixture composition at maximum performance is somewhere around 12.5 (rich), and the BSFC coefficient will depend on what kind of engine you have, naturally aspirated or turbocharged (atmo - 0.4-0.52, for turbo - 0.6-0.75).
Having found out all the necessary data, enter the indicators into the appropriate cells of the calculator and by clicking the “Calculate” button you will immediately receive a result that will show the real engine power of your car with a slight error. Please note that you do not necessarily need to know all the parameters presented; you can clear the power of the internal combustion engine using a separate method.
The value of the functionality of this calculator lies not in calculating the power of a stock car, but if your car has been tuned and its weight and power have undergone some changes.
Other engine types
It is no secret that engines are used not only in cars, but also in industry and even in everyday life. Motors of different sizes can be found in factories - driving shafts - and also in household appliances such as automatic meat grinders.
Sometimes it is necessary to calculate the real power of such engines. How to do this is described below.
It is worth immediately noting that the power of a 3-phase motor can be calculated as follows:
- P = Mtorque * n, where Mtorque is the torque and n is the shaft rotation speed.
External speed characteristic (VSCH)
The external speed characteristic of the engine shows the dependence of power, fuel consumption and torque on the crankshaft speed. All these parameters are shown graphically in the form of curves.
External speed characteristic
In the figure you can see curves with the designations Pe - engine power, Me - torque, ge - specific fuel consumption. As you can see, with increasing speed and power, fuel consumption increases. The torque increases to a certain level and then decreases. At the point where the engine torque and power are most efficient, there will be the most optimal fuel consumption.
Motor manufacturers are fighting to ensure that the engine develops maximum torque in the widest possible speed range (“the torque plateau is wider”), and maximum power is achieved at speeds as close as possible to this shelf. Such an engine will pull you out of the swamp and allow you to accelerate quickly in the city.
The external speed characteristic evaluates the dynamic characteristics of the car, determines efficiency and fuel consumption for different parameters.
High torque at lower speeds increases the unit's traction force, load capacity and maneuverability.
Asynchronous motor
An asynchronous unit is a device whose peculiarity is that the rotational speed of the magnetic field created by its stator is always greater than the rotational speed of its rotor.
The operating principle of an asynchronous machine is similar to the operating principle of a transformer. The laws of electromagnetic induction are applied (the time-varying flux linkage of the winding induces an EMF in it) and Ampere (an electromagnetic force acts on a conductor of a certain length through which a current flows in a field with a certain induction value).
An asynchronous motor generally consists of a stator, rotor, shaft and support. The stator includes the following main components: winding, core, housing. The rotor consists of a core and a winding.
The main task of an asynchronous motor is to convert electrical energy, which is supplied to the stator winding, into mechanical energy, which can be removed from the rotating shaft.
Asynchronous motor power
In the technical field of science, there are three types of power:
- full (denoted by the letter S);
- active (denoted by the letter P);
- reactive (denoted by the letter Q).
The total power can be represented as a vector that has a real and an imaginary part (it is worth recalling the section of mathematics associated with complex numbers).
The real part represents the active power, which is expended to perform useful work such as rotating a shaft, as well as to generate heat.
The imaginary part is expressed by reactive power, which takes part in the creation of magnetic flux (denoted by the letter F).
It is the magnetic flux that underlies the operating principle of an asynchronous unit, a synchronous motor, a DC machine, and a transformer.
Reactive power is used to charge capacitors, creating a magnetic field around the chokes.
Active power is calculated as the product of current with voltage and power factor:
- P = I * U * cosφ.
Reactive power is calculated as the product of current with voltage and power factor, phase shifted by 90°. Otherwise you can write:
- Q = I * U * sinφ.
The value of the total power, if we remember that it can be represented as a vector, can be calculated using the Pythagorean theorem as the root of the sum of the squares of active and reactive power:
- S = (P2+Q2)1/2.
If we calculate the formula for total power in general form, it turns out that S is the product of current and voltage:
- S = I * U.
Power factor cosφ is a value numerically equal to the ratio of the active component to the total power. To find sinφ, knowing cosφ, you need to calculate the value of φ in degrees and find its sine.
This is a standard calculation of motor power by current and voltage.
You might be interested in: Knowledge Engineering. Artificial intelligence. Machine learning
Electric motor power concept
Power is perhaps the most important parameter when choosing an electric motor. Traditionally, it is indicated in kilowatts (kW), for imported models - in kilowatts and horsepower (hp, HP, Horse Power). For reference: 1 hp. approximately equal to 0.75 kW.
The engine nameplate indicates the rated net (output mechanical) power
. This is the power that the engine can deliver to a mechanical load with the stated parameters without overheating. In the formulas, the rated mechanical power is denoted by P2.
Electrical (consumption) power
motor P1 is always greater than the output P2, since there are losses in any energy conversion device. The main losses in an electric motor are mechanical, caused by friction. As you know from a physics course, losses in any device are determined through efficiency (ƞ), which is always less than 100%. In this case, the formula is valid:
Р2 = Р1 · ƞ
The efficiency in engines depends on the rated power - for low-power models it can be less than 0.75, for powerful ones it exceeds 0.95. The above formula is valid for active power consumption. But, since the electric motor is an active-reactive load, to calculate the total power consumption S
(taking into account the reactive component) it is necessary to take into account reactive losses. The reactive component is expressed in terms of power factor (cosϕ). Taking this into account, the formula for the rated engine power looks like this:
Р2 = Р1 · ƞ = S · ƞ · cosϕ
Calculation of the power of a 3-phase asynchronous unit
To calculate the net power on the stator winding of an asynchronous 3-phase motor, you should multiply the phase voltage by the phase current and by the power factor, and multiply the resulting power value by three (by the number of phases):
- Pstator = 3 * Uph * Iph * cosφ.
Electric power calculation engine, which is active in nature, that is, the power that is removed from the engine shaft is produced as follows:
- Poutput = Pstator – Ploss.
The following losses occur in an asynchronous motor:
- electrical in the stator winding;
- in the steel of the stator core;
- electrical in the rotor winding;
- mechanical;
- additional.
To calculate the power of a three-phase motor in the stator winding, which is reactive in nature, it is necessary to add up three components of this type of power, namely:
- reactive power consumed to create stator winding leakage flux;
- reactive power consumed to create leakage flux in the rotor winding;
- reactive power consumed to create the main flow.
Reactive power in an asynchronous motor is mainly spent on creating an alternating electromagnetic field, but part of the power is spent on creating leakage fluxes. Leakage fluxes weaken the main magnetic flux and reduce the efficiency of the asynchronous unit.
Power by current
Calculation of the power of an asynchronous motor can be done using current data. To do this, follow these steps:
Power can always be calculated as the product of current and voltage. In this case, it is important to know which values of U and I should be taken. In this case, U is the supply voltage, it is a constant value, and I can vary depending on which winding (stator or rotor) the current is measured, so it is necessary to select its average value.
Calculation of weight and acceleration time from zero to hundreds
You can also determine how engine power is measured by the total weight of the car and the time it takes to accelerate to 100 kilometers per hour. Unfortunately, this method has a big drawback - the final formula is quite complex and can vary greatly depending on the technical characteristics of the car (type of drive, nature of the transmission, etc.).
Optimal action algorithm:
- Accelerate your car from 0 to 60 kilometers per hour. Determine the acceleration time in any convenient way (usually this is done using the on-board computer).
- Find out the weight of your car - this can be done using the same on-board computer, technical documentation, and so on.
- Use our calculator - enter weight and acceleration time, select drive type, select gear.
Power by size
The stator has many different components, one of which is the core. To calculate engine power using dimensions, follow these steps:
It is better to carry out all measurements and calculations with maximum accuracy so that the calculation of the power of the electric drive motor is as close to reality as possible.
Electric motor power by installation and overall dimensions
For the first method, you need to know the installation dimensions of the electric motor and the synchronous speed. The latter is measured using a multimeter set to milliammeter mode. To do this, set the selection wheel pointer to 100µA. We connect the black probe to the common “COM” socket, and the red probe to the socket for measuring voltage, resistance and current up to 10 A.
After this, de-energize the electric motor and remove the cover from the terminal box. We connect the multimeter probes to the beginning and end of any of the windings (for example, V1 and V2). After this, we slowly turn the motor shaft by hand so that it makes one revolution, and count the number of deviations of the needle from rest that it will make during this time. The number of pointer deflections per shaft revolution is equal to the number of poles and corresponds to this synchronous speed: Now you need to find out the installation dimensions of the motor. For measurements we use calipers, mechanical or electronic, as well as a measuring tape. We record the measurement results in millimeters: the diameter and length of the shaft extension, the height of the axis of rotation, the distance between the centers of the holes in the “legs”, and if the engine is flanged, then the diameter of the flange and the diameter of the mounting holes. We compare the obtained data with the parameters from tables 1-3. Table 1. Determination of engine power by shaft diameter and its reach Table 2. Determination of power by the distance between the holes in the feet Table 3. Determination of power by the diameter of the flange and mounting holes