During the design and creation process, designers carefully consider the aerodynamics of the car, since it has a significant impact on the technical performance of the model.
When a car moves, most of the power of the power plant is spent on overcoming the resistance created by the air. And properly created aerodynamics of the car allows you to reduce this resistance, which means that you will need to spend less power and, accordingly, less fuel to combat the resistance of the oncoming air flow.
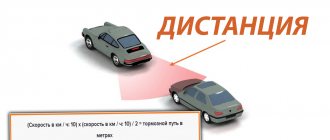
Vehicle aerodynamics measurements are used to study the forces created by air flow on the vehicle. And there are several such forces - lifting and lateral, as well as drag.
Drag and coefficient Cx
For the most part, all work on a car body is aimed at overcoming drag, since this force is the most significant.
Air flow movement
The calculations are based on the force of air resistance. To calculate the result, data such as air density, the transverse projection area of the car, and the aerodynamic drag coefficient (Cx) are used - this is the most important indicator in the aerodynamics of the car. At the same time, the resistance force is also significantly influenced by the speed of movement. So, doubling the speed will be accompanied by a 4-fold increase in resistance. Speed is one of the most powerful factors in increasing consumption.
For example, for a well-streamlined car with a projection area of 2 m2 and a coefficient of 0.3 when driving at a speed of 60 km/h, 2.4 hp are needed to overcome air resistance, and at a speed of 120 km/h already 19.1 hp. With. The difference in fuel consumption under such conditions reaches 30% per 100 km.
If you currently require maximum fuel economy, you need to maintain a constant speed of about 60 km/h. In this driving mode, consumption will be minimal even for a car with a large Cx.
Let's look at everything in a simple way. Air has its own density, and a considerable one. When moving, the car has to pass through the existing air masses, which creates a flow that flows around the body. And the easier it is for a car to “cut” the air mass, the less energy it will spend on it.
But it's not that simple. While driving, an area of increased pressure is created in front of the car (the car compresses the air mass), that is, an invisible barrier is formed in front, complicating the “cutting” of the air mass.
Also, after flowing around the body, the air flow separates from the surface, which causes turbulence and vacuum behind the car. In combination with increased pressure, the resulting vacuum further increases resistance.
Since it is impossible to influence air density, designers can only make adjustments to two other calculated components - the area of the car and the aerodynamic drag coefficient.
But it doesn’t seem particularly possible to reduce the projection of a car without compromising the useful spaces of the body (it’s simply impossible to make a car smaller than it is), so all that remains is to change the Cx coefficient.
This coefficient is established experimentally (in a wind tunnel) and characterizes the ratio of drag to velocity pressure and cross-sectional area of the body. Its size is dimensionless.
Aerodynamic tube
A drop-shaped body has the lowest aerodynamic drag coefficient. When moving in an air mass, such a body smoothly spreads the flow in front of itself, without creating an area of high pressure, and the existing “tail” allows the flow to close behind itself without breaks or turbulence, that is, there is also no vacuum. It turns out that the air simply flows around the body, creating minimal resistance. For such a body, the coefficient Cx is only 0.05.
Designers, working with the aerodynamics of the car, have not yet been able to achieve such indicators. And all because when moving, resistance is created by several factors:
- Body shape;
- Friction of the flow on the surface during flow;
- Flow entering the engine compartment and interior.
Therefore, for modern cars, the aerodynamic drag coefficient is considered excellent if its value is below 0.3. For example, the Peugeot 308 has a coefficient of 0.29, the Audi A2 has a coefficient of 0.25, and the Toyota Prius has a coefficient of 0.26. But it is worth noting that these are estimates under ideal conditions. In practice, while driving, a car is affected by many different factors that negatively affect the resistance of the body.
It is noteworthy that the coefficient is most influenced not by the front of the car, but by its rear. And the reason for this is the creation of vacuum and turbulence as a result of flow separation from the body. Therefore, designers for the most part are engaged in giving the necessary shape to the rear part.
The drag coefficient of the Volkswagen XL1 is only 0.19
The Cx coefficient can also be reduced by reducing the number of protruding parts, everywhere on the car (sides, roof, bottom, front), and those elements that cannot be removed from the surface are given the maximum possible streamlined shape.
Saab 92
When Saab designed the first car, they benefited from their experience in aircraft manufacturing, where aerodynamics play an important role from the very beginning. In 1949, the company released the Saab 92, with an excellent drag coefficient of 0.30.
See also: This is how much more fuel is wasted due to the load on the roof of the car
This car easily covered speeds of 100 km/h, despite the low power of the two-stroke 25-horsepower engine.
Lift and downforce
As a result of uneven air flow around the car from different sides, a difference in the speed of its movement occurs.
Effective lift and downforce
The car moves and cuts through the air flow, while part of this flow goes under the car and passes under the bottom, that is, it moves almost in a straight line. But the upper part of the flow has to follow the shape of the body, and it has to travel a greater distance. Because of this, a difference in air speed occurs - the upper part moves faster than the lower part, passing under the car. And since an increase in speed is accompanied by a decrease in pressure, a zone of increased pressure is formed under the bottom, which lifts the car.
Frontal resistance also adds problems. The area of high pressure of the air mass in front of the car presses the front end to the road, while the vacuum and turbulence behind, on the contrary, contribute to raising the body. Lift, like drag, increases with increasing speed.
A negative factor from the impact of such force is the deterioration of the car's stability with increasing speed and an increase in the likelihood of skidding.
But this force can also have a positive effect. By making adjustments to the design of the car, it is possible to convert the lift force into downforce, which will provide better traction, stability of the car, and its handling at high speeds.
At the same time, no separate solutions are required to obtain downforce. All developments aimed at reducing the Cx coefficient also affect the clamping force. For example, optimizing the shape of the rear end leads to a reduction in turbulence and vacuum, which also reduces lift and increases downforce. Installing the rear spoiler works in the same way.
Reducing turbulence when installing a spoiler
When establishing the aerodynamics of a car, lateral forces are not particularly taken into account, due to the fact that they are not constant and do not have a significant impact on the performance of the car.
But this is all the theory of car aerodynamics. In practice, everything can be explained in one sentence - the worse the aerodynamics, the higher the fuel consumption.
Basics of Automotive Aerodynamics
The designers' task is to skillfully shape individual parts of the body to compensate for areas of turbulence and air separation. It's worth noting how important it is for the different parts to interact properly. Only correctly selected relationships between them lead to a low air resistance coefficient “Cx”. One of the techniques to achieve the correct flow around the roof is its slope. Increasing the rake reduces the drag coefficient. However, when this is applied, the vehicle has a larger frontal area, so the overall drag value may increase. An alternative is to lower the roofline front and rear, but this has the disadvantage of limiting visibility. After many analyses, some designs of this type are put into mass production. The most popular cars using this solution are the VW Passat B5 or Audi A6 C5.
Toyota Prius III (XW30)
The priority when creating the car was to achieve the lowest possible fuel consumption, so the Prius silhouette is guided by the principles of aerodynamics. The wedge-shaped front end and the sloping lines of the roof and tailgate make the appearance of this car very futuristic. One of the stylistic “curiosities” is the split rear window; to improve visibility, a small glass was installed in the vertical part of the tailgate, which, however, gets dirty quite quickly when driving on a wet road. The advantages of this body shape:
- Low fuel consumption;
- Maneuverability;
- Compactness.
The Prius' powertrain consists of a 1.8-liter gasoline engine producing 99 hp. and an 80 hp electric motor. The total system power is 136 hp. These parameters allow it to accelerate from 0 to 100 km/h in 10.4 seconds and reach a maximum of 180 km/h. Many drivers complain that the hybrid howls when accelerating. In fact, a car with a continuously variable transmission behaves differently than one equipped with a classic automatic transmission, but after 2-3 days of driving the noise ceases to bother you and you can experience exceptionally smooth driving and a seamless shift of drive from an electric motor to an internal combustion engine .
Opel Calibra
Opel constructors and designers managed to create not only a timeless body with virtually no interchangeable components, but also achieved mastery in aerodynamics. The CX coefficient was only 0.26! At that time this was the best result in this area. Advantages of the car:
- Body design;
- Dynamics;
- Build quality.
Throughout its production period, the Opel Calibra was offered with a 2-liter 8-valve gasoline engine producing 115 hp. From the start of production, customers could also purchase a 2-liter engine version equipped with a 16-valve head. It had a maximum power of 150 hp. In 1994, it was modernized and its power was reduced to 136 hp. However, this unit is not recommended due to the frequent cracking of head gaskets and even the heads themselves.
In 1992, the range was expanded with the most powerful version with a 2.0-liter turbocharged engine producing 204 hp. The car was equipped with a 6-speed manual transmission and all-wheel drive. The Calibra 2.0 Turbo 4x4 accelerates to 100 km/h in 6.8 seconds.
Hyundai Sonata VI (YF)
The Hyundai Sonata's 4.8-meter-long cabin (with a 2.73-meter wheelbase) offers the roominess of a midsize car. In this category, the car can be compared with the Audi A6, Skoda Superb or Mercedes E-Class; it is more spacious than its competitors from Japan. The low roof and streamlined front bumper provide good aerodynamics. What engines are there?
A car on the secondary market can be purchased with one of three engine versions. Each offers something completely different, the main engine being petrol with a capacity of 2.0 liters and 150 hp. At idle, it consumes enough fuel (10-14 l / 100 km). According to the catalog, it accelerates to hundreds in 8.9 seconds, but in combination with the automatic transmission it seems sluggish.
Opel Astra K
In 1989, Opel introduced the world to the Calibra, a sports coupe with a sensational Cx-factor of 0.26. This result, as history has shown, is not easy to achieve because issues such as the vehicle's safety, its driving characteristics, the cooling of its individual components or its design limit the reduction in the coefficient. But thanks to modern technical measures it can be improved, Opel engineers proved this by introducing the Astra K. Dimensions of the new body:
- Length 4370 mm;
- Width 1809 mm;
- Height 1485 mm.
What else affects aerodynamics?
Of course, designers are trying to reduce the car's drag as much as possible when driving and increase downforce. But the peculiarities of car operation and car owners’ views on the external features of the car make their own adjustments, and in some cases, significant ones.
Aerodynamic drag of different cars depending on speed
For example, installing a roof rack, even with an aerodynamic shape, increases the transverse projection of the car and greatly affects the streamlining, which immediately affects fuel consumption.
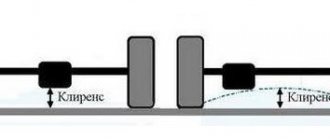
Also, consumption increases from driving with the windows and sunroof open, the use of protective and decorative body kits, transportation of oversized cargo protruding from the car, violation of the position of structural elements located under the bottom, and increased ground clearance.
But the car owner can also make adjustments that will positively affect the aerodynamics of the car. These include the use of aerodynamic body kits, installation of a spoiler, and reduction of ground clearance.
Tatra 87
Introduced in 1936, the Tatra 87 is today a design icon. Thanks to the well-designed rear of the car, the aerodynamic drag value is 0.36. Following the tradition of those years, the Czech automaker installed the engine in the rear of the car.
High speed and low fuel consumption were the Tatra's strong point. It was the perfect highway car for its time. By 1950, 3,000 cars had been produced.
Windage
Fuel consumption, especially at high speeds, is significantly influenced by air resistance (aerodynamic drag) , the aerodynamic drag force is proportional to the square of the speed and is calculated by the formula
where S is the frontal projection area of the car, m2; v – vehicle speed relative to air, m/s; ρ – air density, kg/m3; cх – aerodynamic drag coefficient.
Aerodynamic drag does not depend on the mass of the vehicle [2]. The frontal projection area of the car is determined by the shape of the body and the requirements to ensure a comfortable position for the driver and passengers in the seats. For example, a large car may be lower than a small one, since its seats are often lower. In a small car, due to its light weight and length, the seats are located higher above the floor, and therefore the distance between the front and rear seats is smaller. The more upright position of the driver and passengers in a small class car requires it to be taller but shorter. The frontal projection areas of both cars are almost the same, but the low and long body of a large class car is aerodynamically more advantageous .
The engine power required to overcome aerodynamic drag is therefore proportional to the cube of the speed:
where v is the relative speed of the vehicle, km/h.
The aerodynamic drag coefficient, as can be seen from the table below, varies over a wide range depending on the shape of the car body.
Aerodynamic drag of various cars
| Car body | Air resistance coefficient cx | Power required to overcome aerodynamic drag (kW), with a frontal projection area of 2 m 2 and speed | ||
| 40 km/h | 80 km/h | 120 km/h | ||
| Open quadruple | 0,7 – 0,9 | 1,18 – 1,47 | 9,6 – 11,8 | 31,0 – 40,5 |
| Closed, with corners and edges | 0,6 – 0,7 | 0,96 – 1,18 | 8,0 – 9,6 | 26,4 – 30,8 |
| Closed, with rounded corners and edges | 0,5 – 0,6 | 0,80 – 0,96 | 6,6 – 8,0 | 22,0 – 26,4 |
| Closed pontoon | 0,4 – 0,5 | 0,66 – 0,80 | 5,2 – 6,6 | 17,6 – 22,0 |
| Closed, well streamlined | 0,3 – 0,4 | 0,52 – 0,66 | 3,7 – 5,2 | 13,2 – 17,6 |
| Closed, aerodynamically perfect | 0,20 – 0,25 | 0,33 – 0,44 | 2,6 – 3,3 | 9,8 – 11,0 |
| Freight car | 0,8 – 1,5 | – | – | – |
| Bus | 0,6 – 0,7 | – | – | – |
| Bus with a well-streamlined body | 0,3 – 0,4 | – | – | – |
| Motorbike | 0,6 – 0,7 | – | – | – |
The aerodynamic drag coefficient is determined by blowing the car or its mock-up in a wind tunnel or approximately during operational tests . When tested in a wind tunnel on mock-ups, less accurate values are obtained than from the same tests on real cars. This is due to the fact that the change in air resistance is influenced by inaccuracies in the manufacture of some components and parts of the car: door handles, underbody, bumpers, rear-view mirrors, etc. In addition, the air passing into the body for cooling and ventilation.
At high vehicle speeds, aerodynamic drag is predominant.
The figure below shows the change in power required to overcome rolling resistance Nf and aerodynamic resistance Nv as a function of speed v for a mid-range car. At a speed of 60 km/h, the power required to overcome rolling resistance and air resistance is equal, which is typical for this type of car. Based on the sum of power consumed, one can see the importance of air resistance. At a speed of 80 km/h, the power required to overcome it is 4 times greater than at a speed of 40 km/h, and at speeds higher than 120 km/h, the total power required for movement increases almost in proportion to the cube of the car's speed .
| Power expended to overcome movement resistance |
| The mass of the car is 1350 kg, the frontal projection area S of the car is 2 m 2; rolling resistance coefficient f is 0.015; the aerodynamic drag coefficient cx is 0.456. |
When determining the engine power required to achieve a maximum speed greater than that provided by the rated power of the engine installed on the vehicle, the following relationship can be used without significant error:
where N2 – required power, kW; N1 – achieved maximum power, kW; v2 – required speed, km/h; v1 – achieved maximum speed, km/h.
Through point X - the maximum power N1 at the maximum speed v1 - a curve of power versus cube of speed is drawn. The difference between this curve and the line of power required to drive at maximum speed is negligible.
Why is this necessary?
Everyone knows why a car needs aerodynamics. The more streamlined its body, the lower the resistance to movement and fuel consumption. Such a car will not only save your money, but will also emit less rubbish into the environment. The answer is simple, but far from complete. Aerodynamics specialists, fine-tuning the body of the new model, also:
- calculate the distribution of lift force along the axes, which is very important given the considerable speeds of modern cars,
- provide air access for cooling the engine and brake mechanisms,
- think over the places of air intake and outlet for the interior ventilation system,
- strive to reduce noise levels in the cabin,
- optimize the shape of body parts to reduce contamination of glass, mirrors and lighting equipment.
Moreover, the solution to one task often contradicts the implementation of another. For example, reducing the drag coefficient improves streamlining, but at the same time worsens the vehicle's resistance to crosswind gusts. Therefore, specialists must seek a reasonable compromise.
Aerodynamic drag of the car
During the design and creation process, designers carefully consider the aerodynamics of the car, since it has a significant impact on the technical performance of the model.
When a car moves, most of the power of the power plant is spent on overcoming the resistance created by the air. And properly created aerodynamics of the car allows you to reduce this resistance, which means that you will need to spend less power and, accordingly, less fuel to combat the resistance of the oncoming air flow.
Vehicle aerodynamics measurements are used to study the forces created by air flow on the vehicle. And there are several such forces - lifting and lateral, as well as drag.